Bihar in numbers: if there's a Vikas Purush in the state, it's Nitish

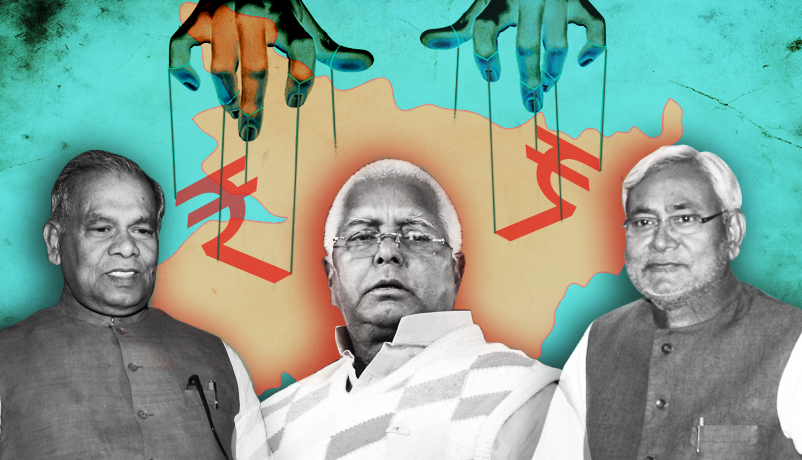
The first round of polling in Bihar is round the corner. The spotlight has largely been on personalities, war of words and caste calculations.
A few questions still remain unanswered - What are the socio-economic realities of Bihar? Did the decade long rule of Nitish Kumar usher in any development?
In the first part of Catch's Bihar in Numbers series, we look at Bihar's economy, what the state is doing right and what it isn't.
rupees
- The amount spent on social services by Bihar in 2014-15.
- This is approximate cost of about 1,000 Boeing Airbus A 320.
- This was 47% of the total expenditure (development + non development) by Bihar.
- More than half of this expenditure was for education, sports, arts and culture.
- Only Tamil Nadu, Maharashtra and Uttar Pradesh allocated more funds for social services than Bihar.
- Growth in Bihar state domestic product (as a simple aggregate) between 2005 to 2011.
- Bihar's growth surpassed states like Maharashtra and Gujarat making it the biggest GDP gainer in the country.
- Growth was driven by three sectors. Agricultural growth was highest in the country between 2004-09. There was a turnaround in industrial fortunes from negative growth between 2000-04 to 5.8 between 2004-09. The third sector was construction.
- "I believe that the economic boom in Bihar is real, not a statistical fudge. A visit to Bihar provides plenty of anecdotal proof. During RJD's time, anybody building a house or booking a new car promptly got a ransom note. Today home construction and car sales are booming," wrote noted economist Swaminathan Aiyar in his personal blog in 2010.
- The per capita income of Patna, Bihar's most prosperous district, as of 2011-12.
- At today's rate, people of Patna can buy 20 grams of gold with their per capita income.
- In terms of per capita income, the most backward districts in Bihar are - Sheohar (Rs 7,092 ), Supaul (Rs 8,492) and Madhepura (Rs 8,609).
- Bihar's per capita income almost doubled under Nitish's tenure: from Rs 8,773 in 2004-5 to Rs 17,294 in 2013-14. However, it is still much lower than other states.
- Bihar's economic survey for 2014-15 says that Sheohar, Supaul, Madhepura, Sitamarhi, Nawada, Darbhanga, Araria and Madhubani are the most disadvantaged districts across indicators like per capita incomes, consumption of diesel, petrol and cooking gas.
- The share of rural households that are electrified in Bihar, according to a report by Indiaspend based on National Sample Survey Organisation data.
- Concurrently, the per capita power consumption is 144 kilowatt/hour, 85% lower than the all India average of 927 kilowatt/hour.
- Bihar faces a power deficit (the difference between peak demand and electricity supplied) of 19%, according to the Economic Survey 2014-15.
- However, according to Nitish Kumar, electricity network should not be confused with household electrification.
- "We link every village with the electricity network so that those willing to take electricity connection can have it," Nitish said during an interaction few days back.
tonnes
- Production of rice and wheat in Bihar in 2013-14. This reflected an excellent growth from earlier.
- In contrast, 52,800 tonnes of steel were used to build the Sydeny Harbour Bridge.
- Production of rice in Bihar doubled between 2010-11 and 2013-14.
- This rise in production is explained by the introduction of new techniques in agriculture, newer agricultural implements and bringing more area under irrigation.
- In the last five years 1,39,787 pump sets were distributed to farmers as subsidy along with 24,375 tractors.
rupees
- Agricultural credit disbursed to farmers in Bihar between 2007-08 to 2013-14.
- This amount can buy about 15,000 3BHK flats in any upmarket locality in India- from Bandra, Worli to even Hauz Khas.
- Loans to farmers increased by more than 500% from 2007 to 2013-14.
- Bihar is one of the few states which reported zero farmer suicides in 2014.
- However, agricultural credit doesn't seem to have reached farmers in backward districts. In districts like Saharsa, Supaul, Madhepura, Sheikhpura, Jehanabad and Arwal, agricultural credit flow was either zero or negligible.
- The increase in the number of factories in Bihar between 2005-06 and 2011-12.
- During the same period, factories in India grew by only 55%.
- Net value added by industries in Bihar increased by more than 1000% during this period and employment nearly doubled too.
- However, as of 2011-12, Bihar accounted for a meagre 1.49% of all factories across India. It added a net value of only Rs 1.3 crore per factory as against Rs 4.8 crore across India and the input-output ratio of factories decreased from 96 in 2005-06 to 90 in 2011-12.
rupees
- Proposed investment cleared by the State Investment Proposal Board through 1,891 projects (mostly food processing) till September 2014.
- This amount is less than half of the Tata Group's total revenue in 2013-14.
- It is expected that the investment will generate employment for 2.17 lakh people.
- But only 14.4% of all projects are functional, 9.3% of projects are in various stages of implementation and investment of only Rs 7,466 crore has been cleared.
- Despite all these proposals and resurgence, Bihar remains industrially weak.
- That is the road length in Bihar per 100 square kilometres as of 2012-13.
- The all India average was much lower at 142 km.
- As of September 2014, Bihar had a total road length of 2.2 lakh km, registering an increase of 25% over 2013. Simultaneously, road length of national highway increased by 120 km.
- The share of Bihari workers in India's total workforce though Bihar accounts for 8% of India's population.
- Bihar has one of the lowest proportion of young people in the country. But youth unemployment (15 to 29 age group) is 17.5%, much higher than the national average of 13%.
- The rate of unemployment is higher among Bihar's educated youth as compared to those who are illiterate.
It is evident from the above facts that Bihar has improved substantially since the days of utter lawlessness and chaos. Nitish Kumar has achieved a lot as against what he inherited.
Nonetheless, Bihar suffers from strucutural backwardness, which cannot be removed by even by the consistently high growth it has witnessed under Nitish. Therefore, what Bihar actually needs is a special status, rather than a one-time special package.
First published: 9 October 2015, 12:01 IST

_251372_300x172.jpg)
![BJP's Kapil Mishra recreates Shankar Mahadevan’s ‘Breathless’ song to highlight Delhi pollution [WATCH]](http://images.catchnews.com/upload/2022/11/03/kapil-mishra_240884_300x172.png "BJP's Kapil Mishra recreates Shankar Mahadevan’s ‘Breathless’ song to highlight Delhi pollution [WATCH]")

![Anupam Kher shares pictures of his toned body on 67th birthday [MUST SEE]](http://images.catchnews.com/upload/2022/03/07/Anupam_kher_231145_300x172.jpg "Anupam Kher shares pictures of his toned body on 67th birthday [MUST SEE]")


