India's 10 year green report card: GHG emissions rose by 40%, CO2 up 60%


India has declared the latest available data of its greenhouse gas (GHG) emissions. GHGs, which include carbon dioxide, methane, and other gases, are responsible for causing global warming and climate change. The data, submitted in a report to the United Nations, is for 2010. It shows India's emissions grew by 40% from 2000 to 2010, thanks to a 60% rise in carbon dioxide emissions. Emissions from industrial activities nearly doubled in the period. At the same time, for every rupee of GDP generated, our emissions in 2010 were 12% lesser than in 2000.
The report also throws up some interesting figures. Did you know that there has been a 24% increase in emissions from waste? Or that the burning of agricultural residue, which causes the north Indian smog every winter, caused the same emissions as 1 lakh return flights between Delhi and Mumbai?
This data was submitted as per the United Nations Framework Convention on Climate Change, which says developing nations should regularly report their progress on dealing with climate change. The main report is known as a "national communication". In 2010, it was decided that countries will additionally file an update every two years. The current submission is such an update (called the Biennial Update Report (BUR)).
This is India's first BUR, over one year beyond the December 2014 submission deadline. The Paris agreement signed last December had also called on nations to submit their reports soon. China is yet to submit it.
Our last "national communication" was in April 2012, when we submitted 2000 data. These submissions are the only official data we have on India's emissions; all others are estimates.
- The increase in India's greenhouse gas emission from 2000 to 2010.
- In 2010, India emitted 2136 Megatonnes of CO2 equivalent.
This includes not just CO2, but also other gases like methane and other gases (measured as equivalent to CO2, so that the numbers can be added together).
- CO2 has the highest share in GHG emissions, followed by methane.
- The share of CO2 in India's greenhouse gas emissions in 2010. This is more than in 2000, when the share was 67%.
- India's CO2 emissions shot up 60% in the 10 years. But this was also accompanied by a 30% improvement in the removal of the gas, typically through afforestation.
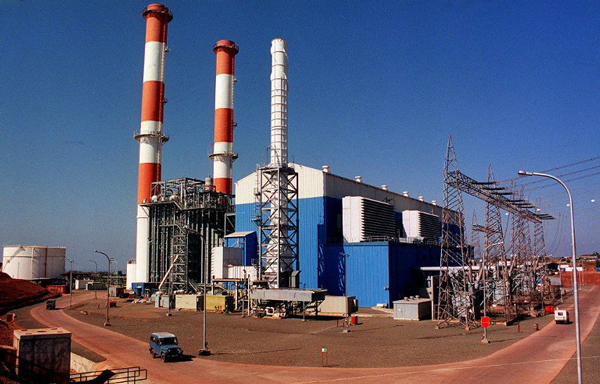
This picture shows the Dabhol power station at the port town of Dabhol, 200 kms south of Bombay, by US-based Enron Corp. Photo: AFP
- The share of methane in India's greenhouse gas emissions in 2010. It is much lesser than the 27% share in 2000.
- Methane is generated in the agricultural sector, mainly from farm animals (responsible for half of methane emissions), and rice cultivation (one-fifth).
India's overall methane emissions have not increased from 2000 to 2010; they have marginally fallen.
- This again proves that Union minister Maneka Gandhi wrong. She had recently claimed that India is "one of the main players" in causing climate change because of its methane emissions. As Catch has reported before, facts tell the opposite story.
Besides, as industrialisation picked up from 2000 to 2010, agriculture's share in emissions declined.
- The share of agriculture in the total emissions in 2010. But in 2000, this share was 23%.
- On its own, agriculture's emissions increased 10% over the period to 390 Megatons in 2010.
Within agriculture, emission from agricultural soils increase the most -- up to 42% -- in the period. Rice cultivation was responsible for lesser emissions in 2010 than in 2000.
- With greater industrialisation, declining share of agriculture share was accompanied by a big rise in emissions from industries and energy production.
- The increase in emissions from generating energy in 2000-2010. This is the biggest sector contributing to India's emissions. Totally, 1510 Megatonnes of CO2 equivalent were emitted in 2010.
- Emissions from industrial activities, the second largest contributor to GHG emissions, nearly doubled from 2000 to 2010.
In 2010, more than half of the emissions among industrial activities came from the "minerals" category, followed by chemicals and metal production (about 14% each).
Some interesting trends
- The greenhouse gas emissions in 2010 from burning agricultural residue. The burning causes a haze over north India every winter, and is responsible for fall in air quality in cities.
- The emissions in 2010 are 15% higher than in 2000, showing that there was no regulation of crop waste burning in the period.
The total emissions are equivalent to the GHG emissions caused by almost 1 lakh return flights running from Delhi to Mumbai in a year.
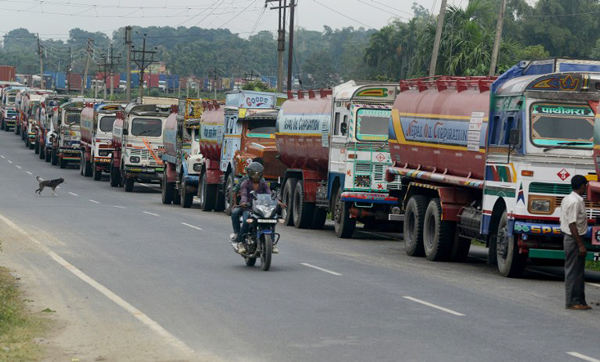
A motorcyclist drives past a row of parked Indian trucks transporting goods and a Nepalese oil tanker near the India-Nepal border at Panitanki, some 40 kms from Siliguri on 3 November, 2015. Photo: Diptendu Dutta/AFP
- Increase in carbon emissions due to waste from 2000 to 2010.
- About 65 Megatonnes of CO2 equivalent were emitted from waste in 2010. Surprisingly, 80% of this was was from "waste-water handling".
However, the contribution of waste to the country's entire greenhouse gas emissions has remained in 3-4% range.


![BJP's Kapil Mishra recreates Shankar Mahadevan’s ‘Breathless’ song to highlight Delhi pollution [WATCH]](https://images.catchnews.com/upload/2022/11/03/kapil-mishra_240884_300x172.png "BJP's Kapil Mishra recreates Shankar Mahadevan’s ‘Breathless’ song to highlight Delhi pollution [WATCH]")

![Anupam Kher shares pictures of his toned body on 67th birthday [MUST SEE]](https://images.catchnews.com/upload/2022/03/07/Anupam_kher_231145_300x172.jpg "Anupam Kher shares pictures of his toned body on 67th birthday [MUST SEE]")


